Energy Dashboard

A UI for monitoring resource consumption/production within a city district.

Description

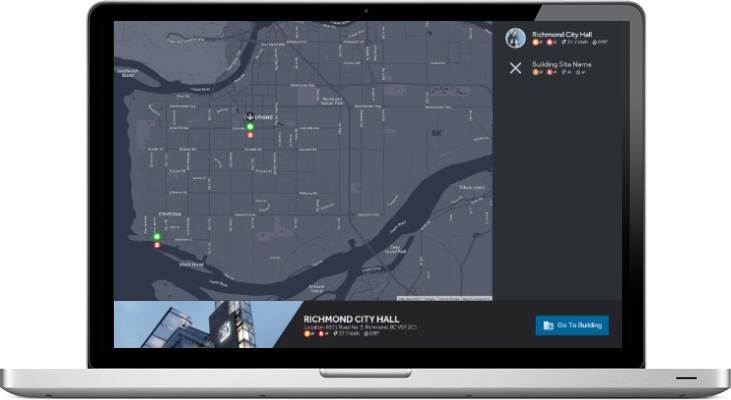
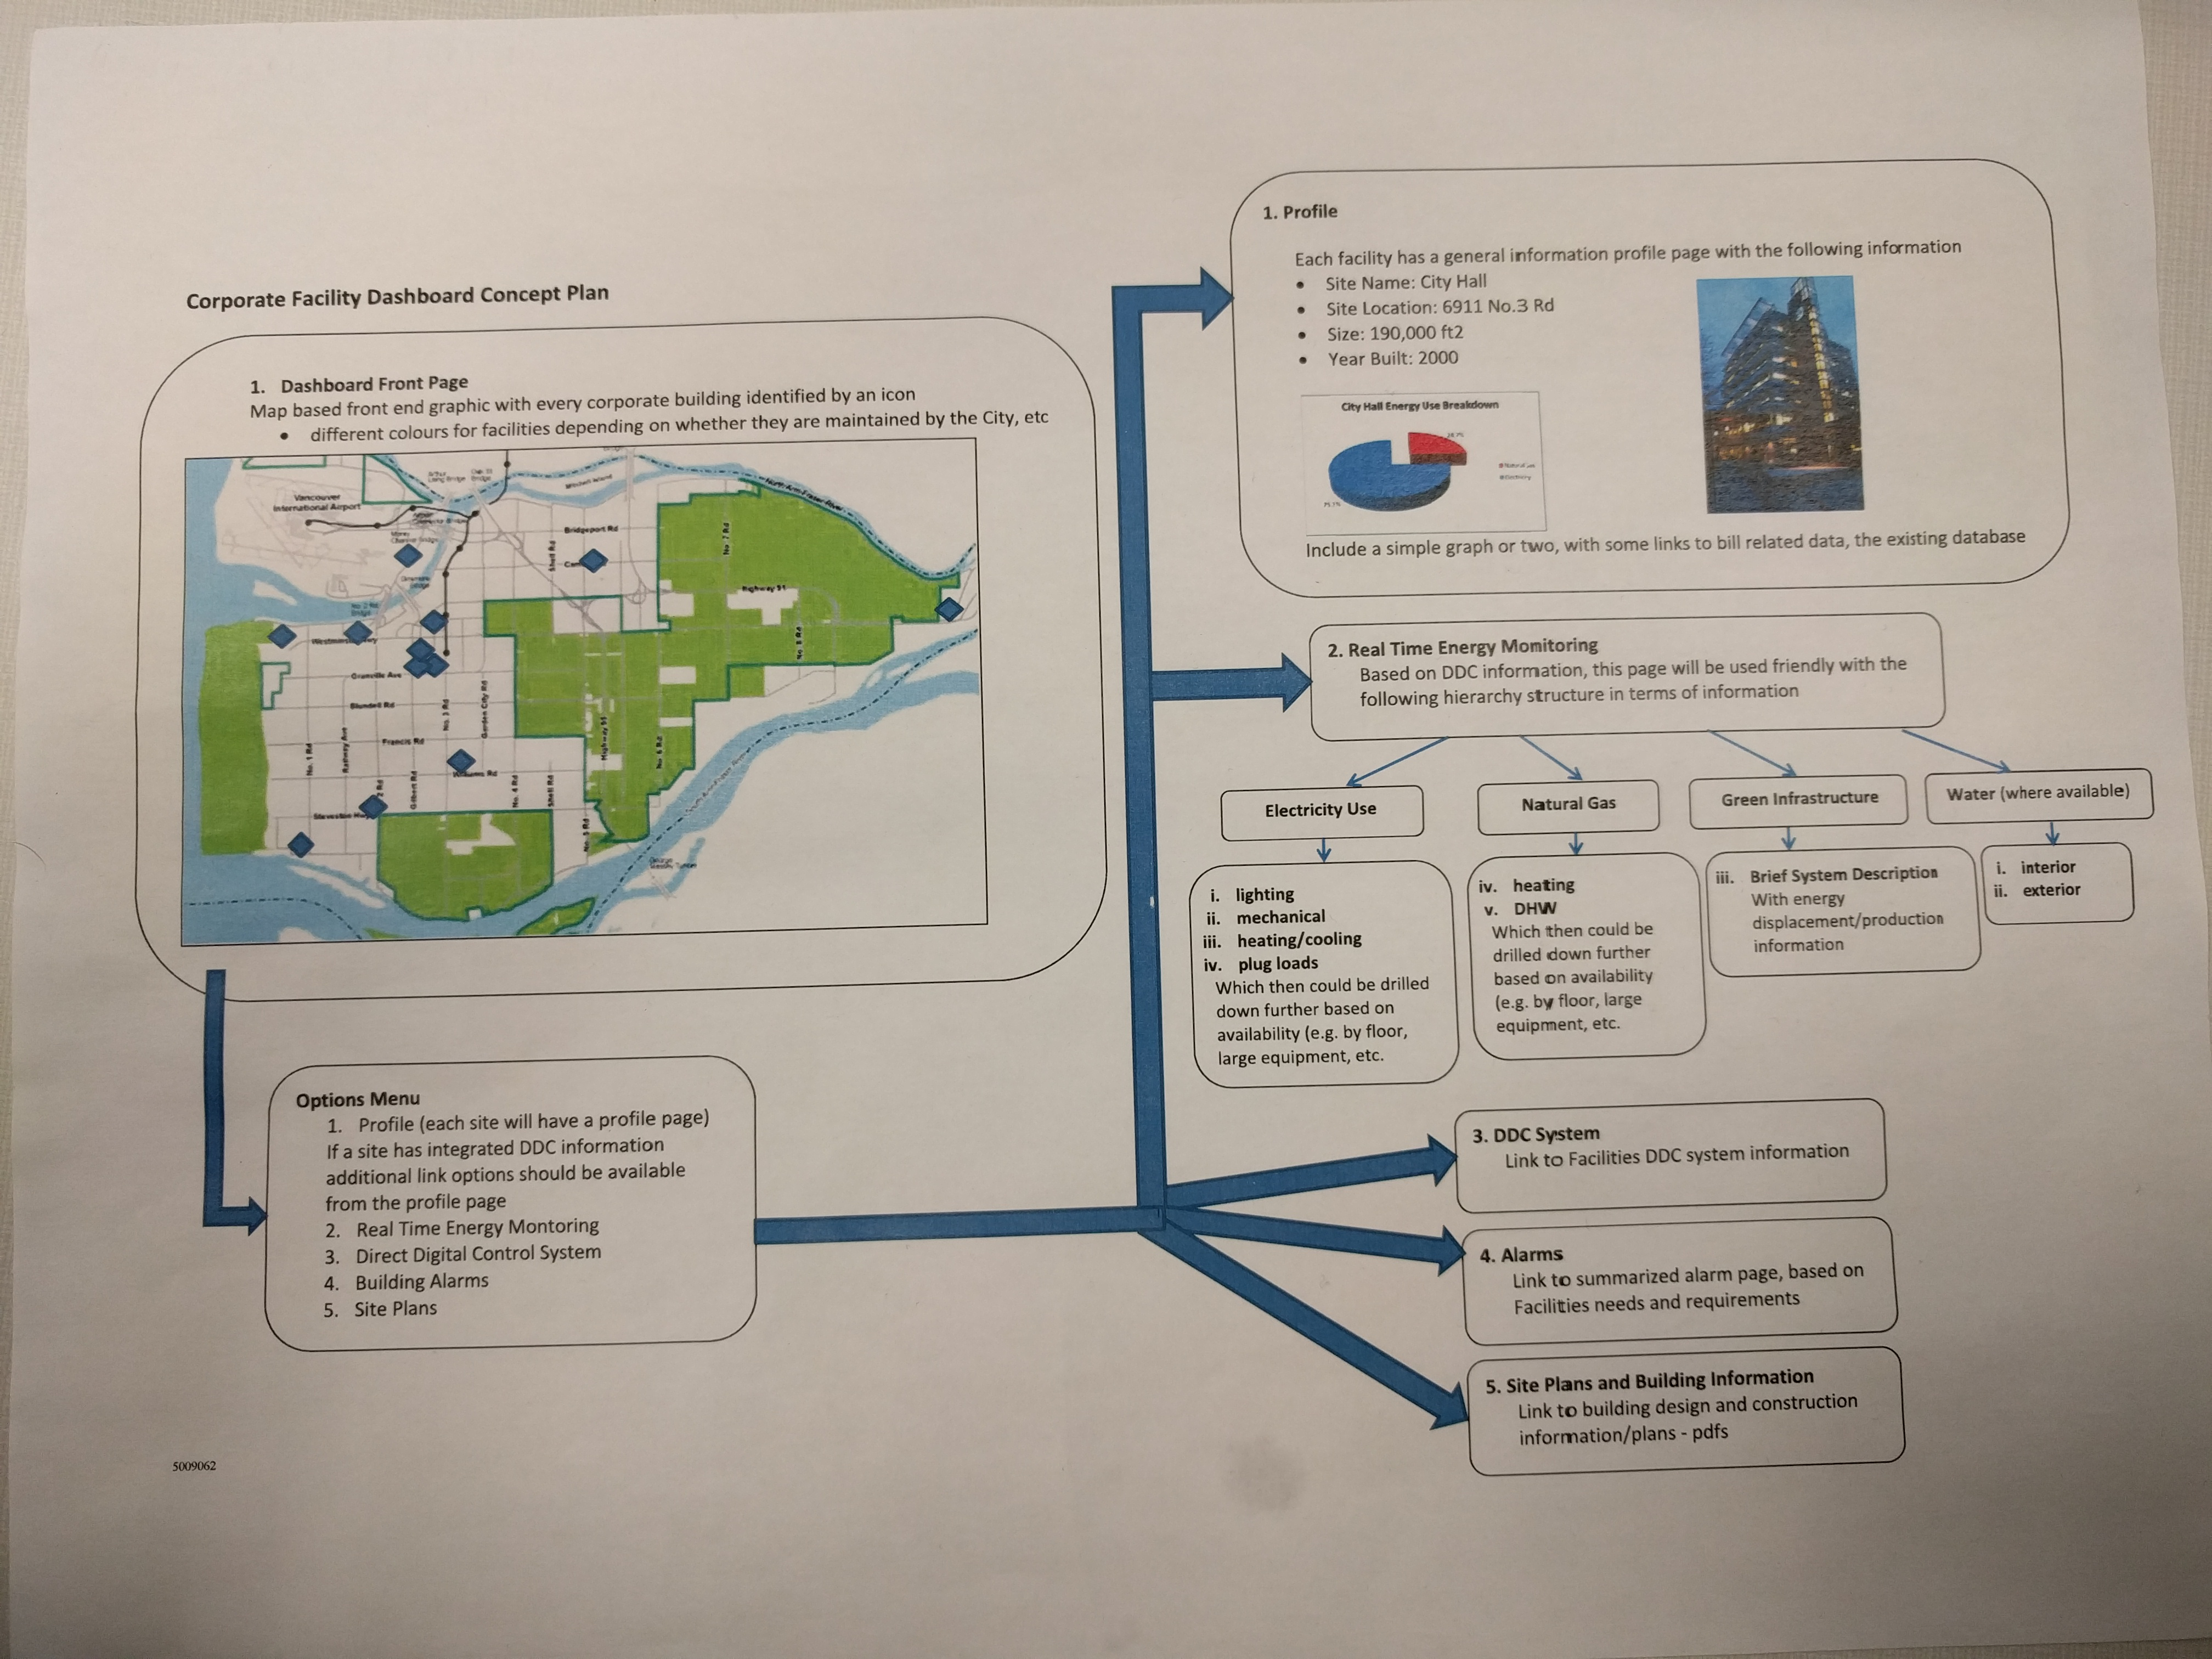
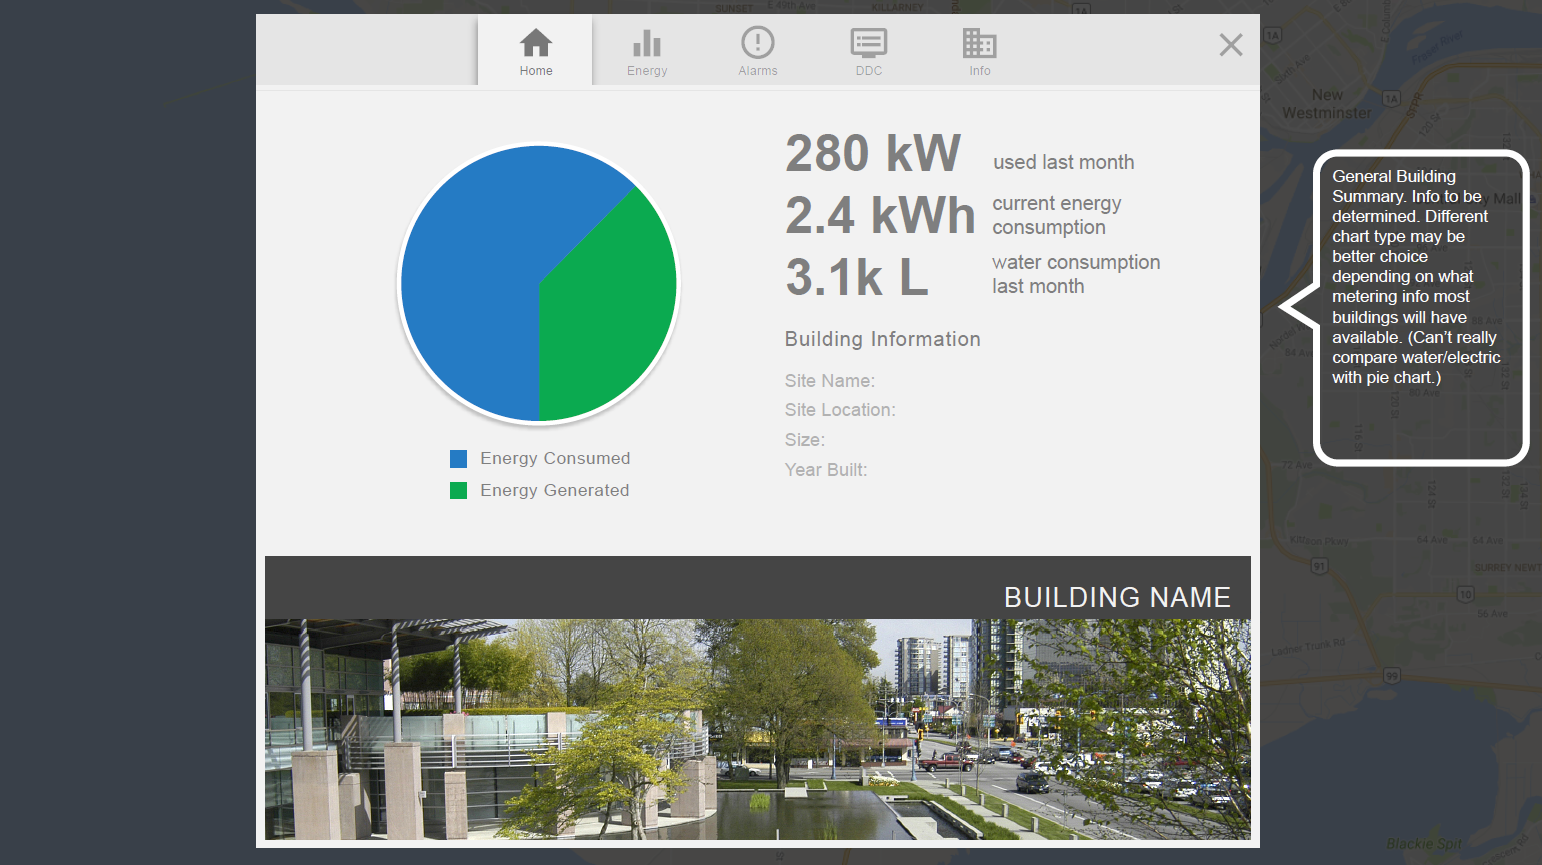
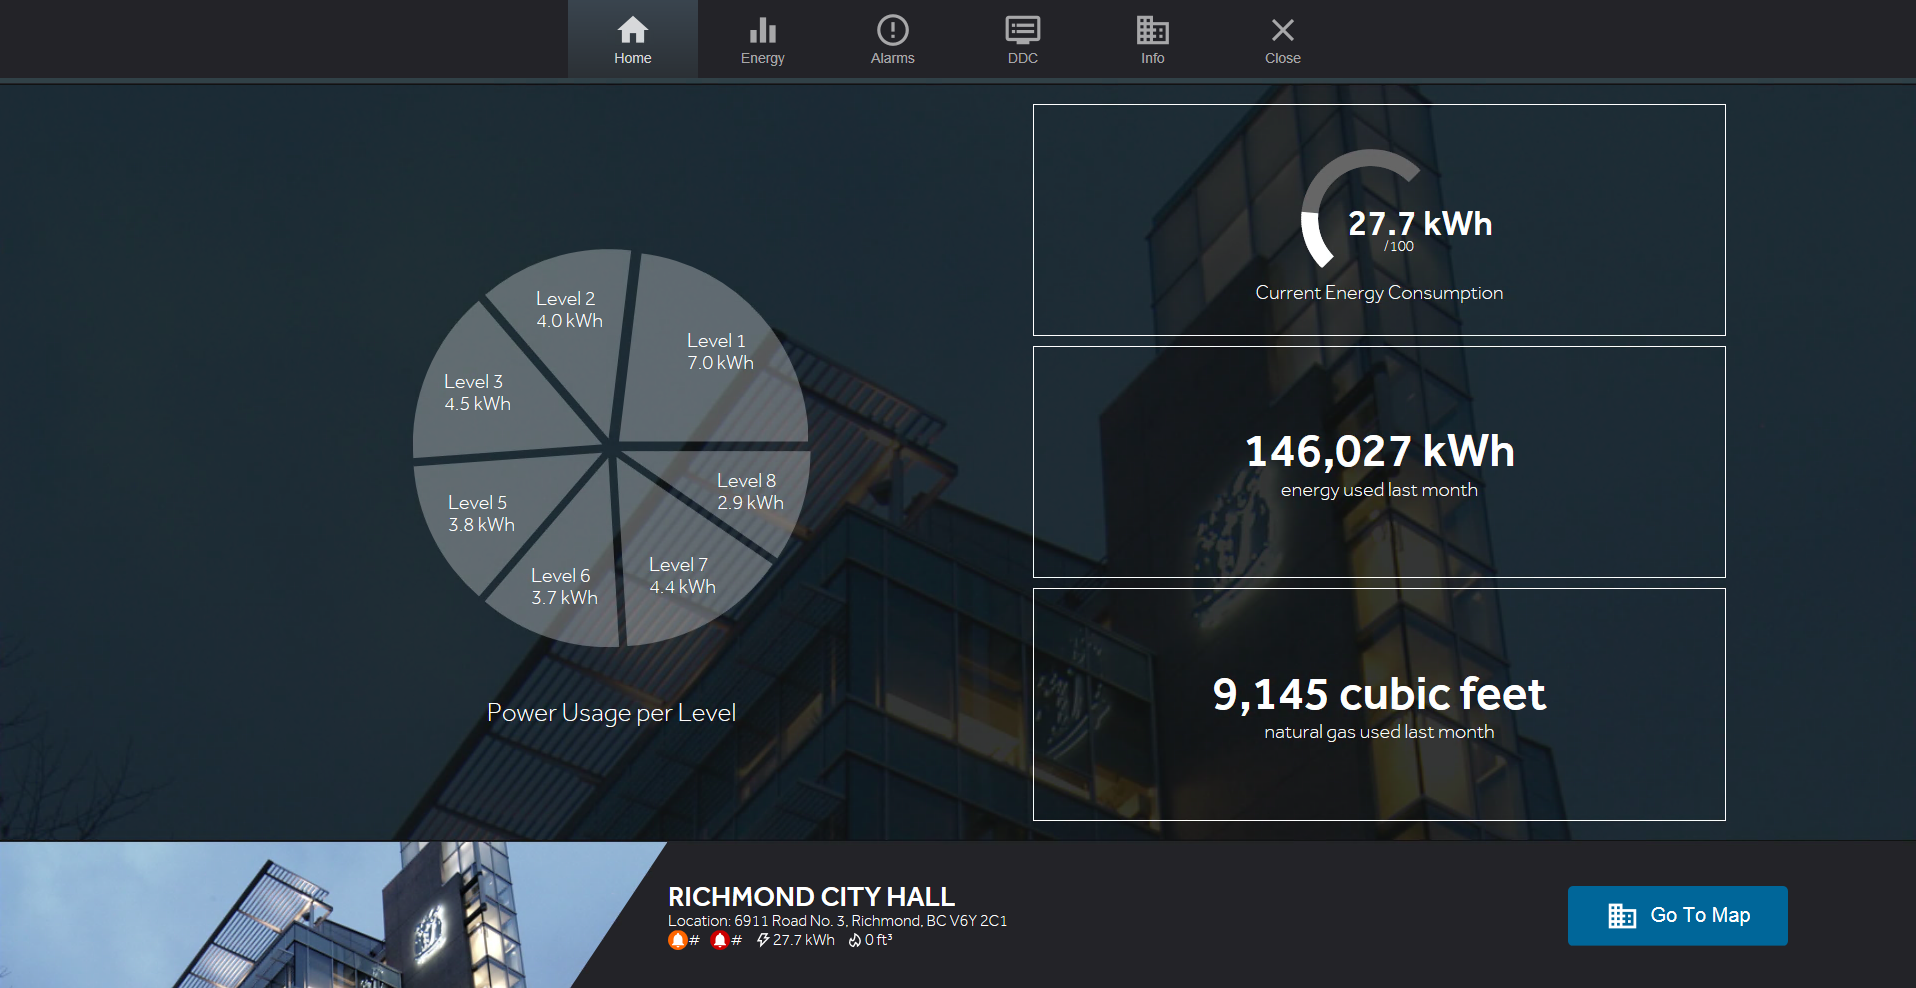
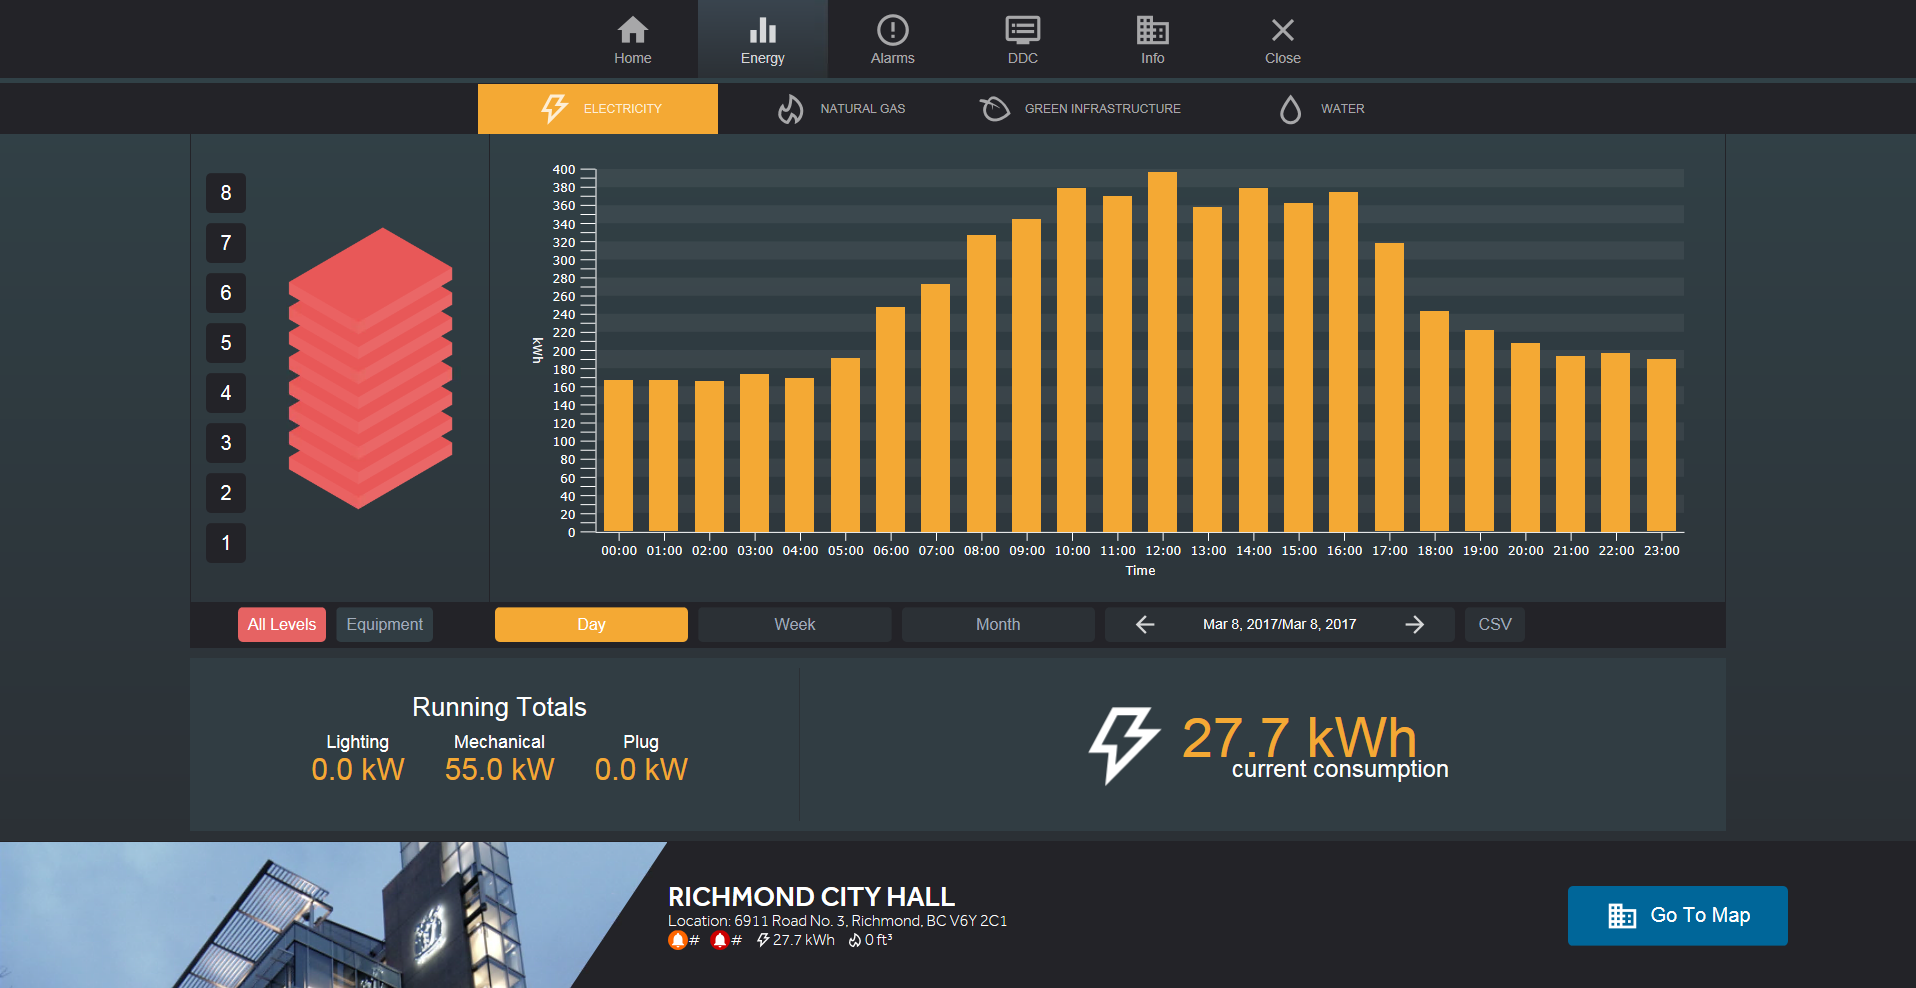
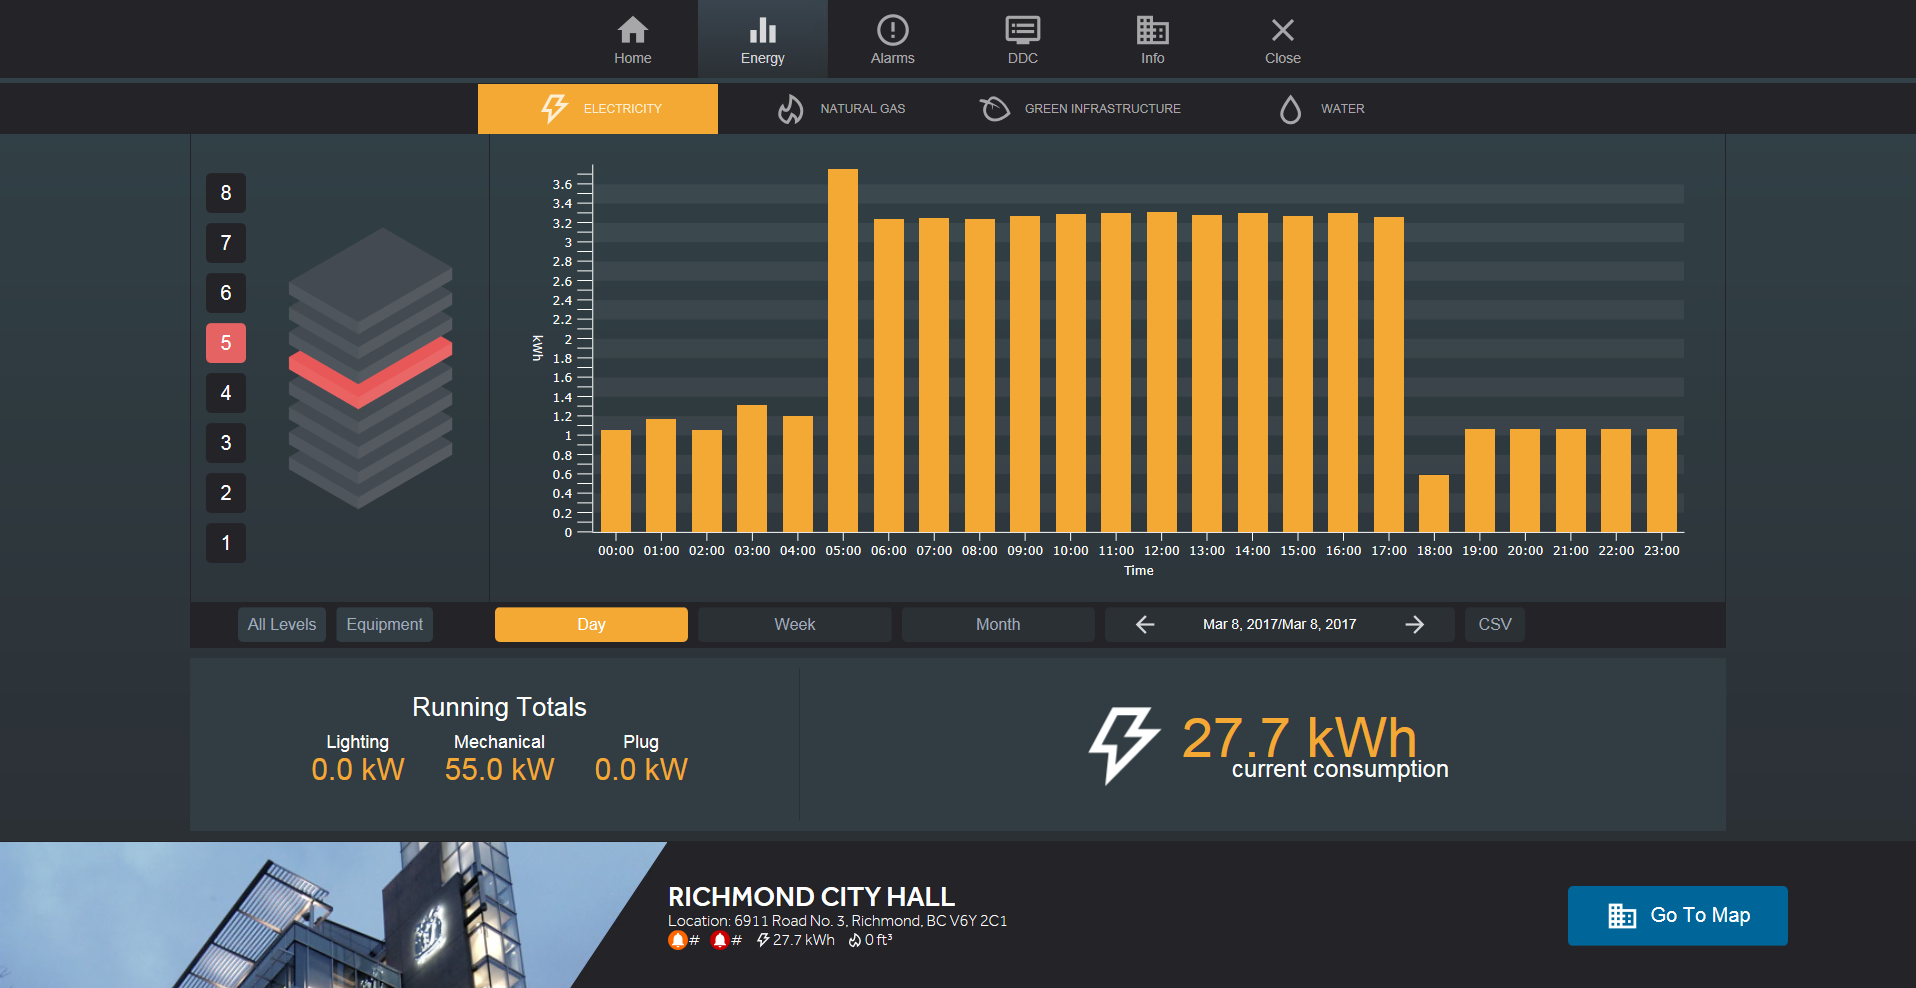
The City of Richmond commissioned ESC Automation to design a platform which they could access inidividual building operations while also providing a display of energy useage from the large to small scale.

Role

I worked solo on the visual design, UI, and development of the system. Coordinating with the application engineers and the city, I collected and organized the information they provided to produce a easily accessible representation of their energy useage.

Building Controls on Laptop

Background

A simple site map of the dashboard design was provided, but the specific information that would be displayed was up to me to define. I had to be aware of what data would be relevant to the user and build layers of depth to drill down into the details of energy usage within a structure.

Dashboard Site Map

Process

Some preliminary mockups were provided to the customer and feedback was given on the visual style. The choice to make the theme dark instead of light was to allow the data to pop out more prominantly. Additional information was provided on the map interface to show comparisons between buildings. The navigation was adjusted to allow more room for data to be shown.

Initial Mockups
Initial Dashboard Mockup

Latest Iteration

The latest iteration has a functional map displaying the locations of each building as well as a summarized display of the current energy consumption. Each individual building will have an energy breakdown of electricity, gas, water, and/or renewable sources. Users can even drill down to individual pieces of mechanical equipment and view the historical data according to day/week/month.

Prototype
Energy Dashboard 1 Energy Dashboard 2 Energy Dashboard 3